Reports
The Reports view under the Compliance tab provides comprehensive insight into the compliance status of all scanned infrastructure.
Note
Dates in Compliance Reports
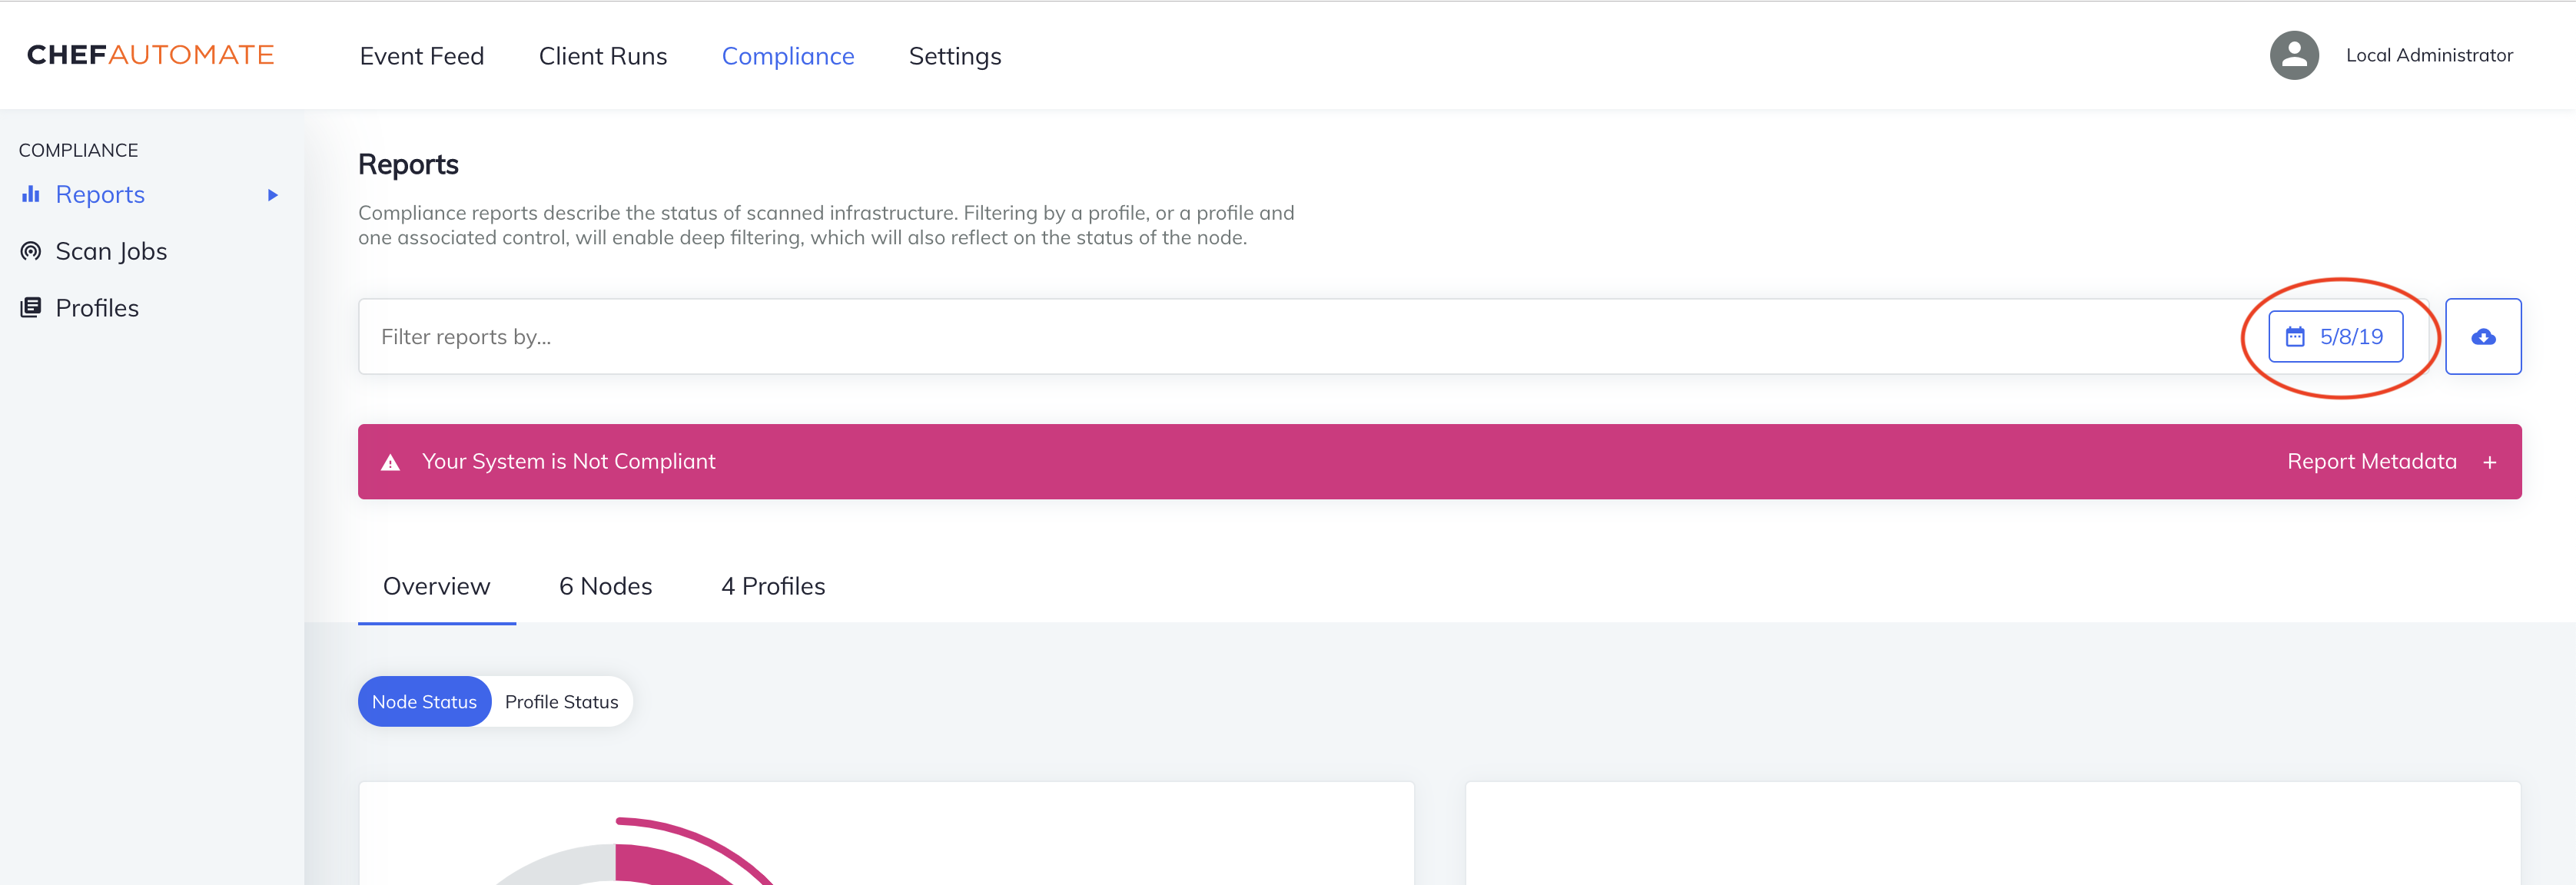
The dashboard shows the results of all scans with end times on the currently selected day. The currently selected day, as highlighted in the search bar, bases itself on timestamps in Coordinated Universal Time (UTC).
A historical view is provided through the trend graph, which can be adjusted to show a 10 day, month, 3 month, or year overview.
To view scan reports in the past, users can select a different date from the calendar located in the search bar.
Compliance Data Sources
Users with audit cookbook configurations can expect to see the results of those scans land in this view. The results of any scan jobs executed in Chef Automate also land in this view.
Search Bar and Filters
The Compliance search allows you to view and filter compliance scan results based on a defined set of filters.
Wildcard searches on field values will not return suggestions, but they will filter the results.
For example, you can search for Node Name: prod* and filter the results to list all the node names that begin with prod.
- Profile
- Filter your results by profile. This list will include any executed profiles (a profile for which scan results have been received).
- Node
- Filter your results by node item. A node is any scannable for which we have received scan results, which can be a Chef node, an aws node, an aws account region, or any other target inspec supports.
- Platform
- Filter your results by platform.
- Environment
- Filter your results by environment.
- Control
- Filtering your results by control will show you the status of the nodes in your infrastructure that ran that control.
- Role
- Filter by Chef role, on all applicable nodes.
- Recipe
- Filter by Chef recipe, on all applicable nodes.
Deep Filtering
Deep Filtering allows you to view the state of your infrastructure from the perspective of a single profile, or a single profile and one of its child controls.
Adding a profile filter will modify all compliance reports screens to display the status of that profile across all nodes executing that profile. Adding a filter for a child control of that profile will modify all compliance reports screens to display the status of that child control.
Please note the only supported filters for deep filtering are:
* one profile
* one profile and one of its child controls
Waivers
A node’s waived status appears if applicable in displays where a node’s status appears in Chef Automate. The Compliance Reports overview displays the node count and history of waived nodes, and the count and history of waived controls. Nodes and Profiles views include Waived Nodes and Waived Profiles status filters respectively. Select the Waived status filter to display only the respective Node or Profile reporting with that status. Hover over the control’s Waived icon under the Node Status column in Controls to view more details about the waiver applied to the control.
Use Chef InSpec to configure waivers.
Download Report Results
The download button located to the right of the search bar allows the user to download a JSON or CSV format of the reports, based on all currently applied filters (including end time selected in calendar).
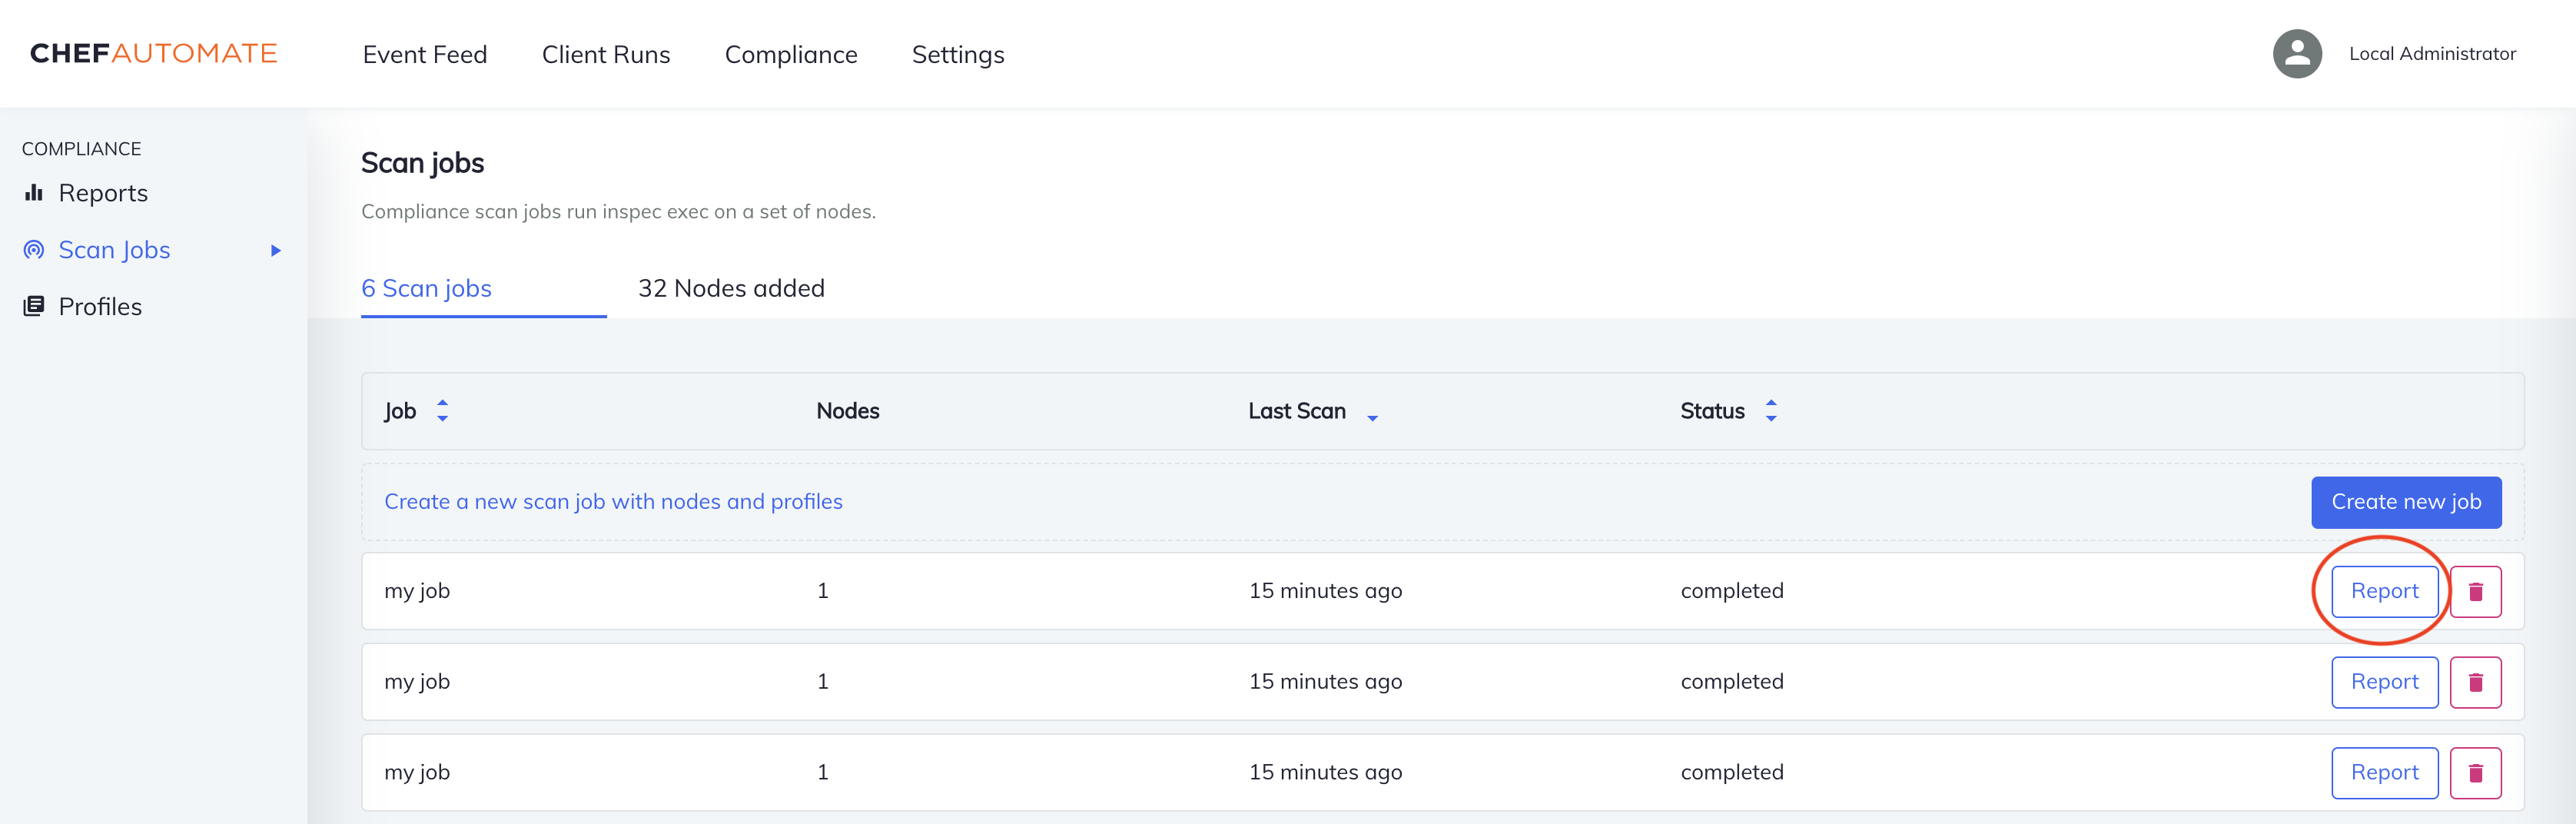
Compliance Reports Results and Job ID Filters
Chef Automate users can see the results of their scan jobs from https://automate.example.com/compliance/scan-jobs/jobs by selecting Report, which will redirect to the compliance tab. This reports view uses the job id filter as well as any additional filters, and ignores the end time filter.
Compliance Status and Report Metadata
The Compliance Status and Report Metadata bar resides directly beneath the search bar. Selecting anywhere on the compliance status bar expands the Report Metadata information, which summarizes the nodes, report date, duration, status, number of platforms, number of environments, and number of profiles used in your scan.

Status Views
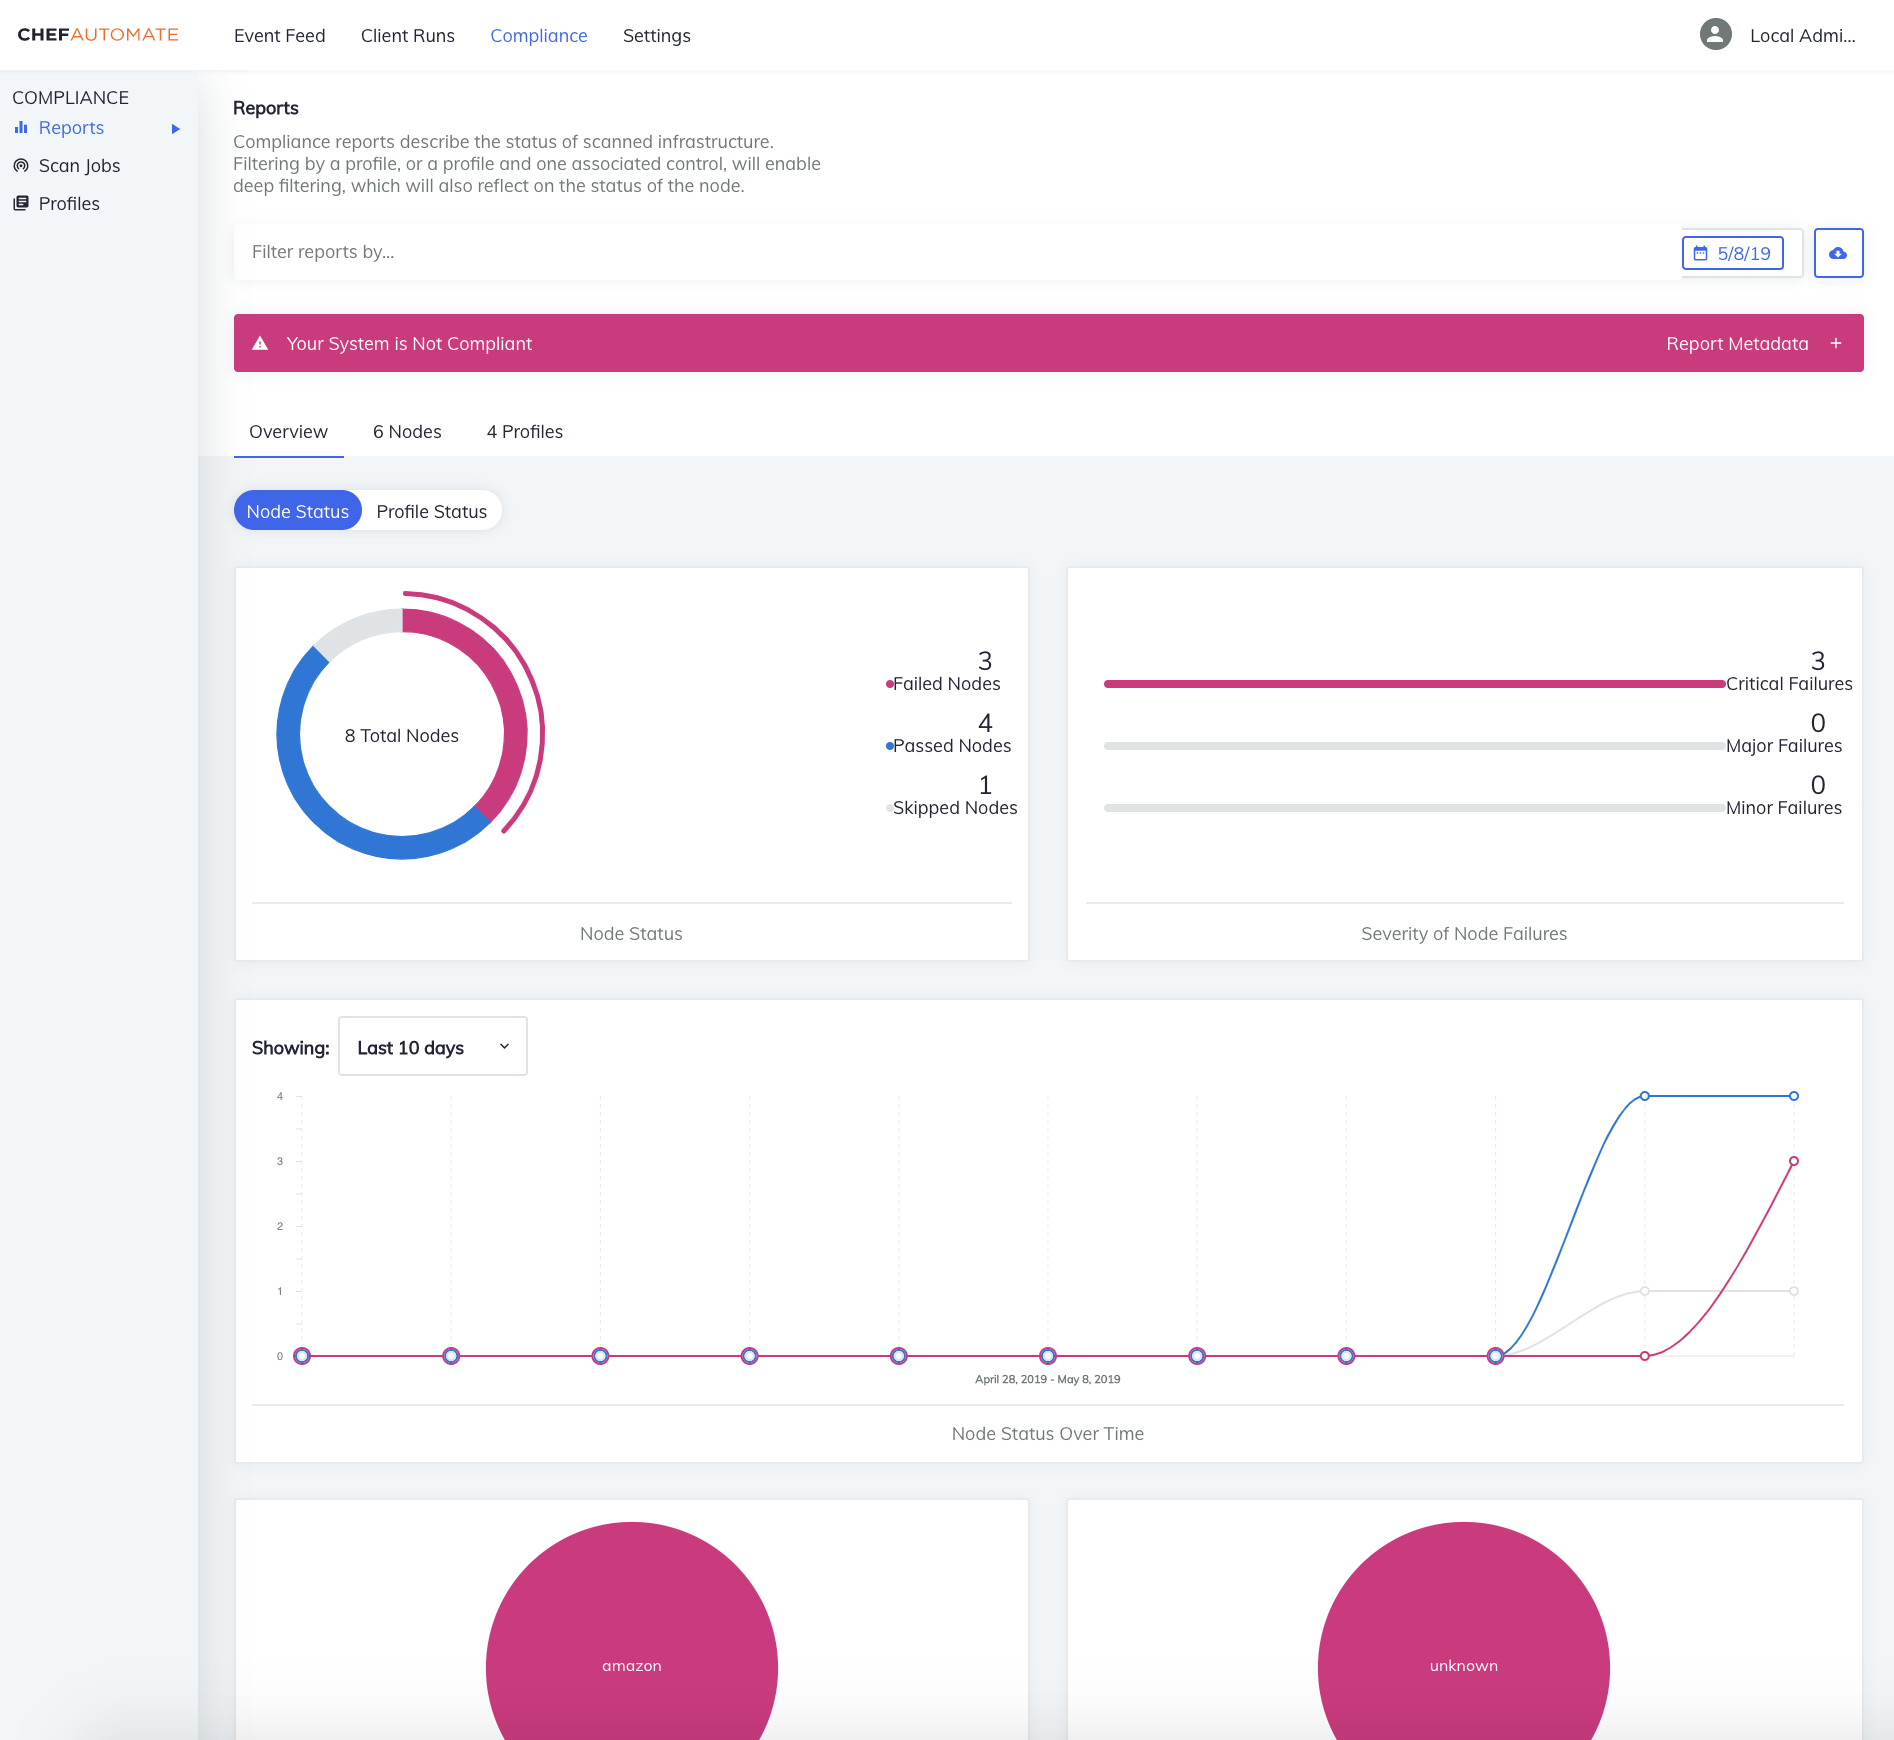
The compliance overview provides insights into the status of your system. Toggle between the Node Status and System Status to view your system’s overall compliance.
Node Status
The node status overview provides insight into your system’s compliance status from the operational perspective of nodes.
- Global Compliance
- Visualizes the quantity of nodes that have passed a failed compliance scans, as well as the number of nodes that were skipped.
- Severity of Node Failures
- Indicates the severity of the compliance scan failures on your system’s nodes.
- Global Compliance Over Time
- Represents the changes in size and compliance status of your system over times. The calendar in the upper right corner of the visualization allows you to change the dates represented in this view,
- Top Platform Failures
- Represents the amount of compliance scan failures ranked by operating system. Hovering over an individual bubble shows the platform and the number of nodes impacted.
- Top Environment Failures
- Represents the amount of compliance scan failures ranked by environment. Hovering over an individual bubble shows the environment and the number of nodes impacted.
Profile Status
The profile status overview provides insight into your system’s compliance status from the compliance perspective of Compliance profiles run during scans.
- Control Status
- The control status displays the number of controls in your system, organized by passing, failing, and skipped controls.
- Severity of Control Failures
- Displays a ranked view of the number and significance of failed controls, sorted into critical, major, and minor control failures.
- Test Results Over Time
- A line graph representing the quantity of controls and Compliance scan results over time. The time-frame can be altered using calendar button in the upper right corner of the chart.
- Top Profile Failures
- Indicates the profiles with the highest failure rate. Hovering over an individual bubble shows the full name of the profile and the number of nodes impacted.
- Top Control Failures
- The Top Control Failures chart illustrates the most frequently failing controls. Hovering over an individual bubble shows the name of the control and the number of nodes impacted.
Switching views
In addition to filtering your reports data, you can also switch your views to see compliance report results from the perspective of Nodes, Profiles, and Controls.
Nodes
This view provides more detailed insight into the compliance status of the nodes in your system. This table can be sorted by node name, platform, environment, last scan, and the number of control failures from the most recent compliance scan.
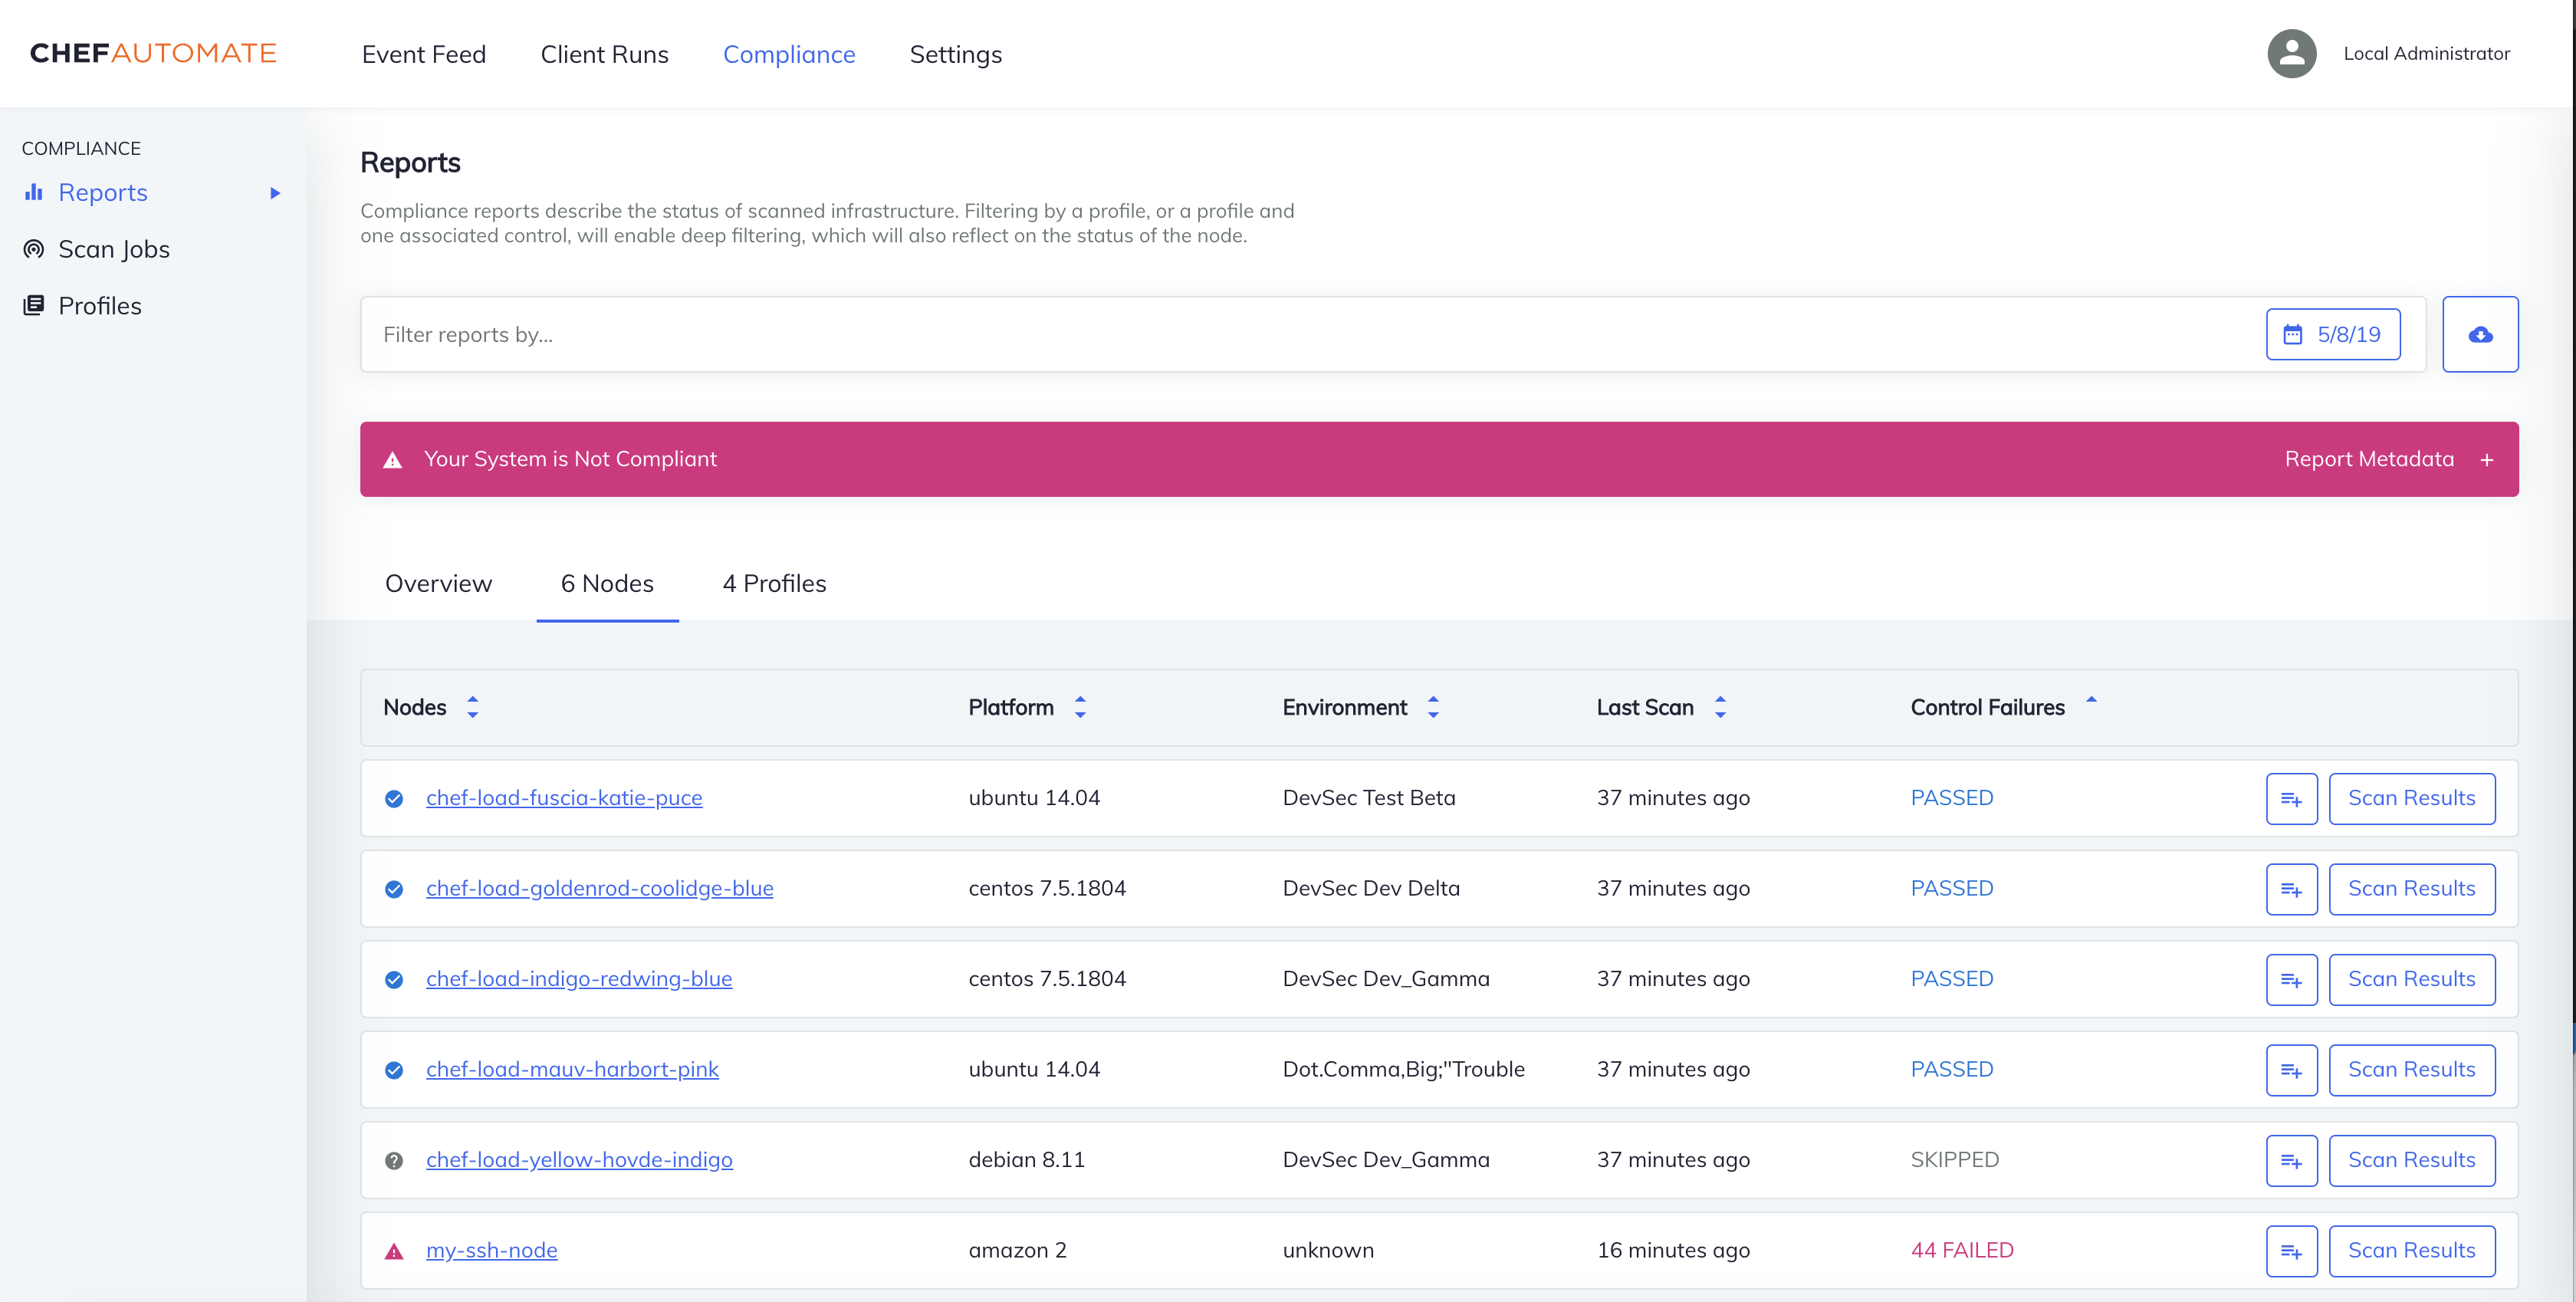
- Node
- A node is any machine that is under management by Chef.
- Platform
- The operating system on your node such as AIX, Amazon Linux, Apache, AppleOSX, CentOS, Oracle Linux, Oracle Solaris, RHEL, SUSE Linux, Ubuntu, and Microsoft Windows.
- Environment
- You can filter compliance reports by the environments in any stage of your workflow.
- Last Scan
- Time in hours, days, or months since the last scan on that node.
- Control Failures
- Shows the number of failing controls, if any.
- Filter
- Select a node by selecting the filter icon on the right side of the row.
- More Information
- Selecting the more information icon redirects you to the results of the most recent compliance scan. Use this view to examine all of the controls run on the node. Selecting View Source from an expanded control displays the full InSpec control.
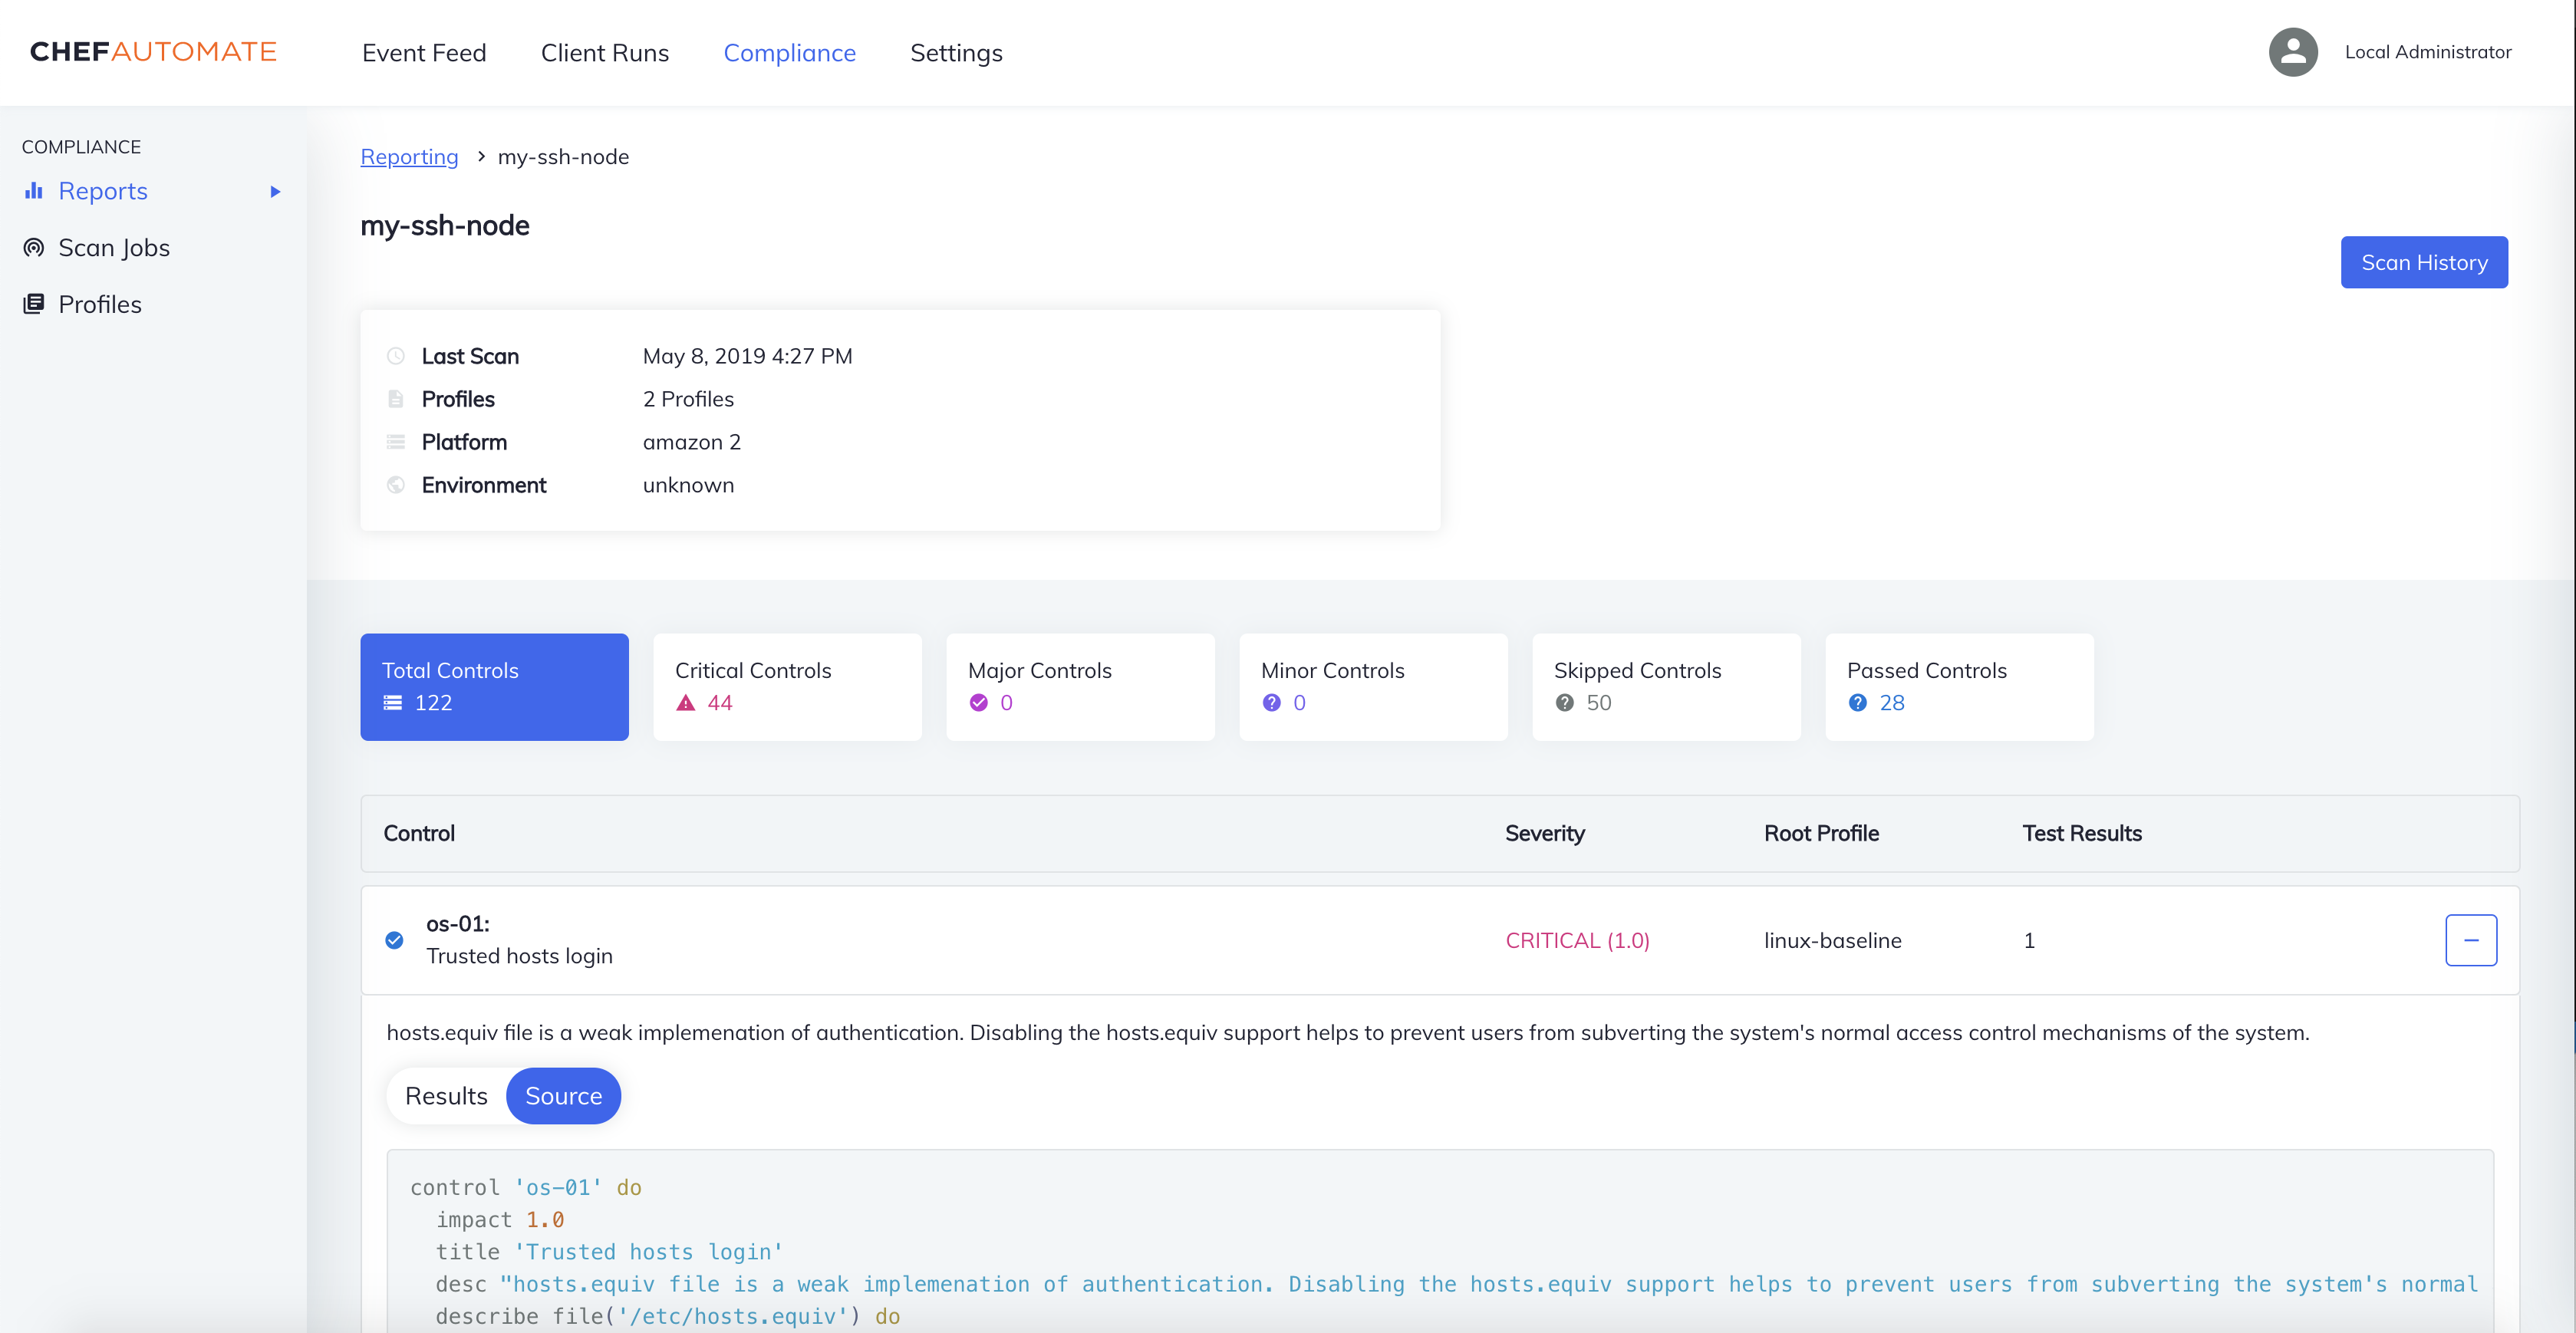
Scan History
Selecting scan history on the upper right corner of the screen opens a side-window. Choosing a compliance scan from this list redirects you to a view of all of the controls run during the selected scan.
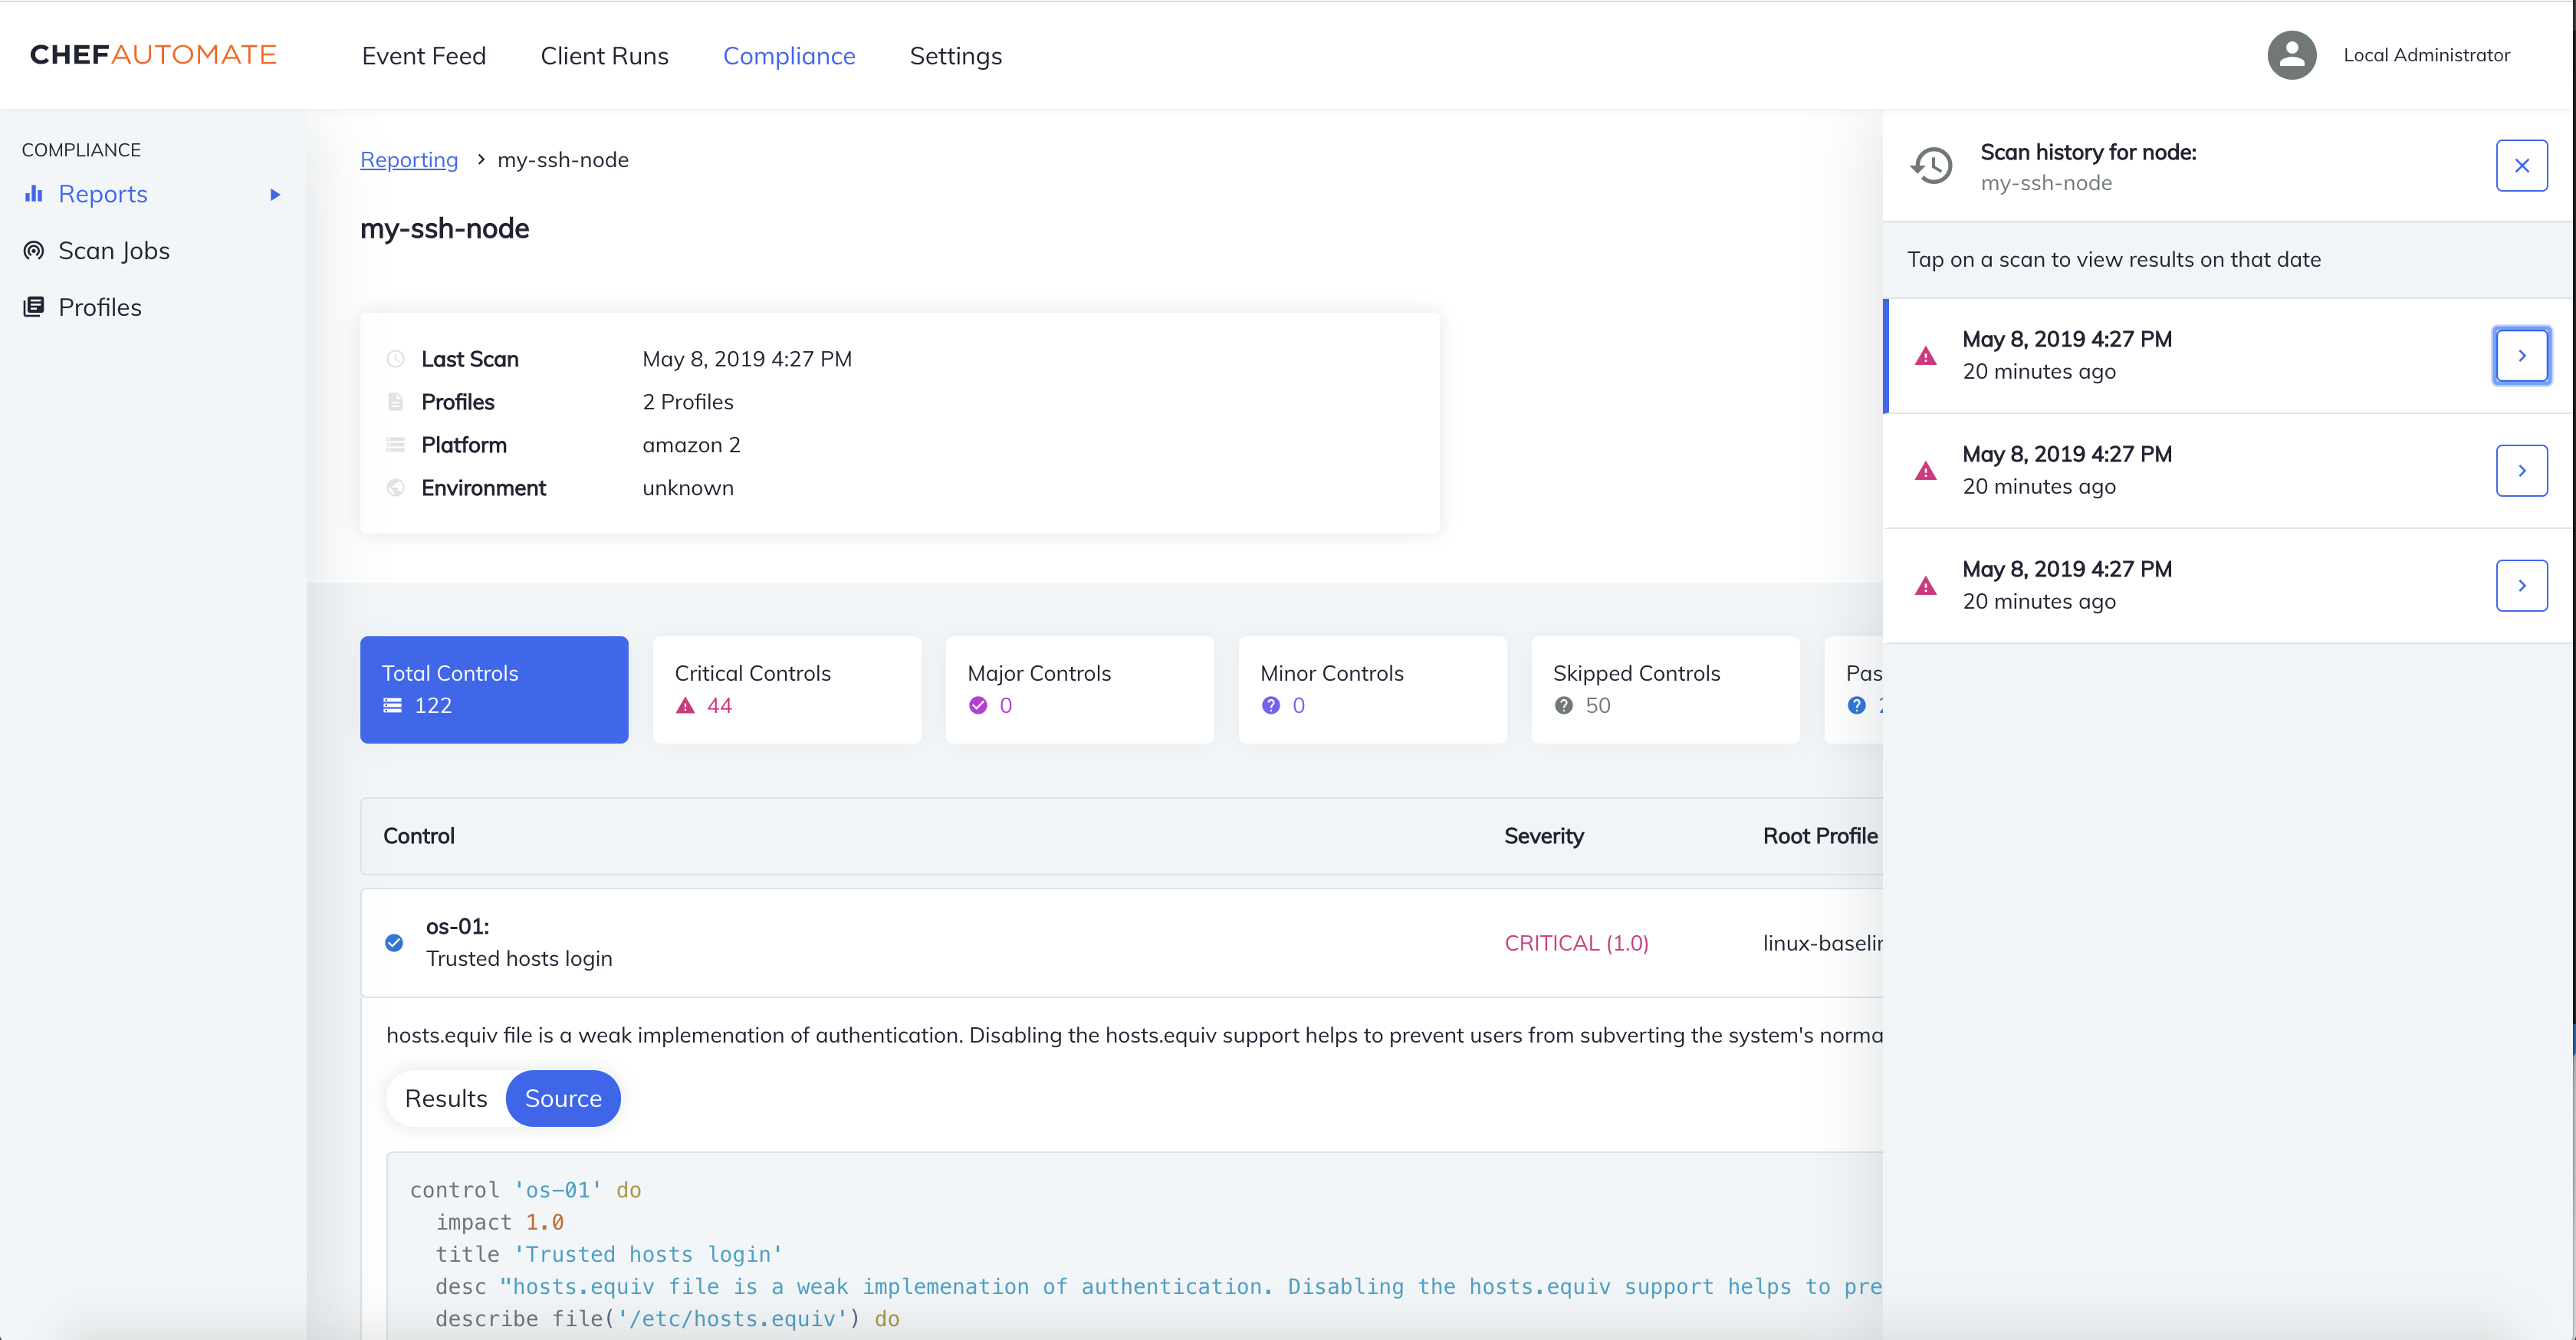
The node name is at the top of the header, directly above the node compliance status. To the right is a summary of node information: Last Scan, Profiles, Platform and Environment.
The node history table displays the following information:
- Control
- Control name and short description of its purpose.
- Test Results
- Number of tests within an individual control
- Severity
- Importance of the control
- Root Profile
- Profile containing the controls.
- More Information
- View the tests within a control and their results. Use the View Source button within the expanded view to examine the InSpec control source code.
Profiles
Use the compliance reports Profiles tab lets you examine the compliance profiles installed under your individual user account.
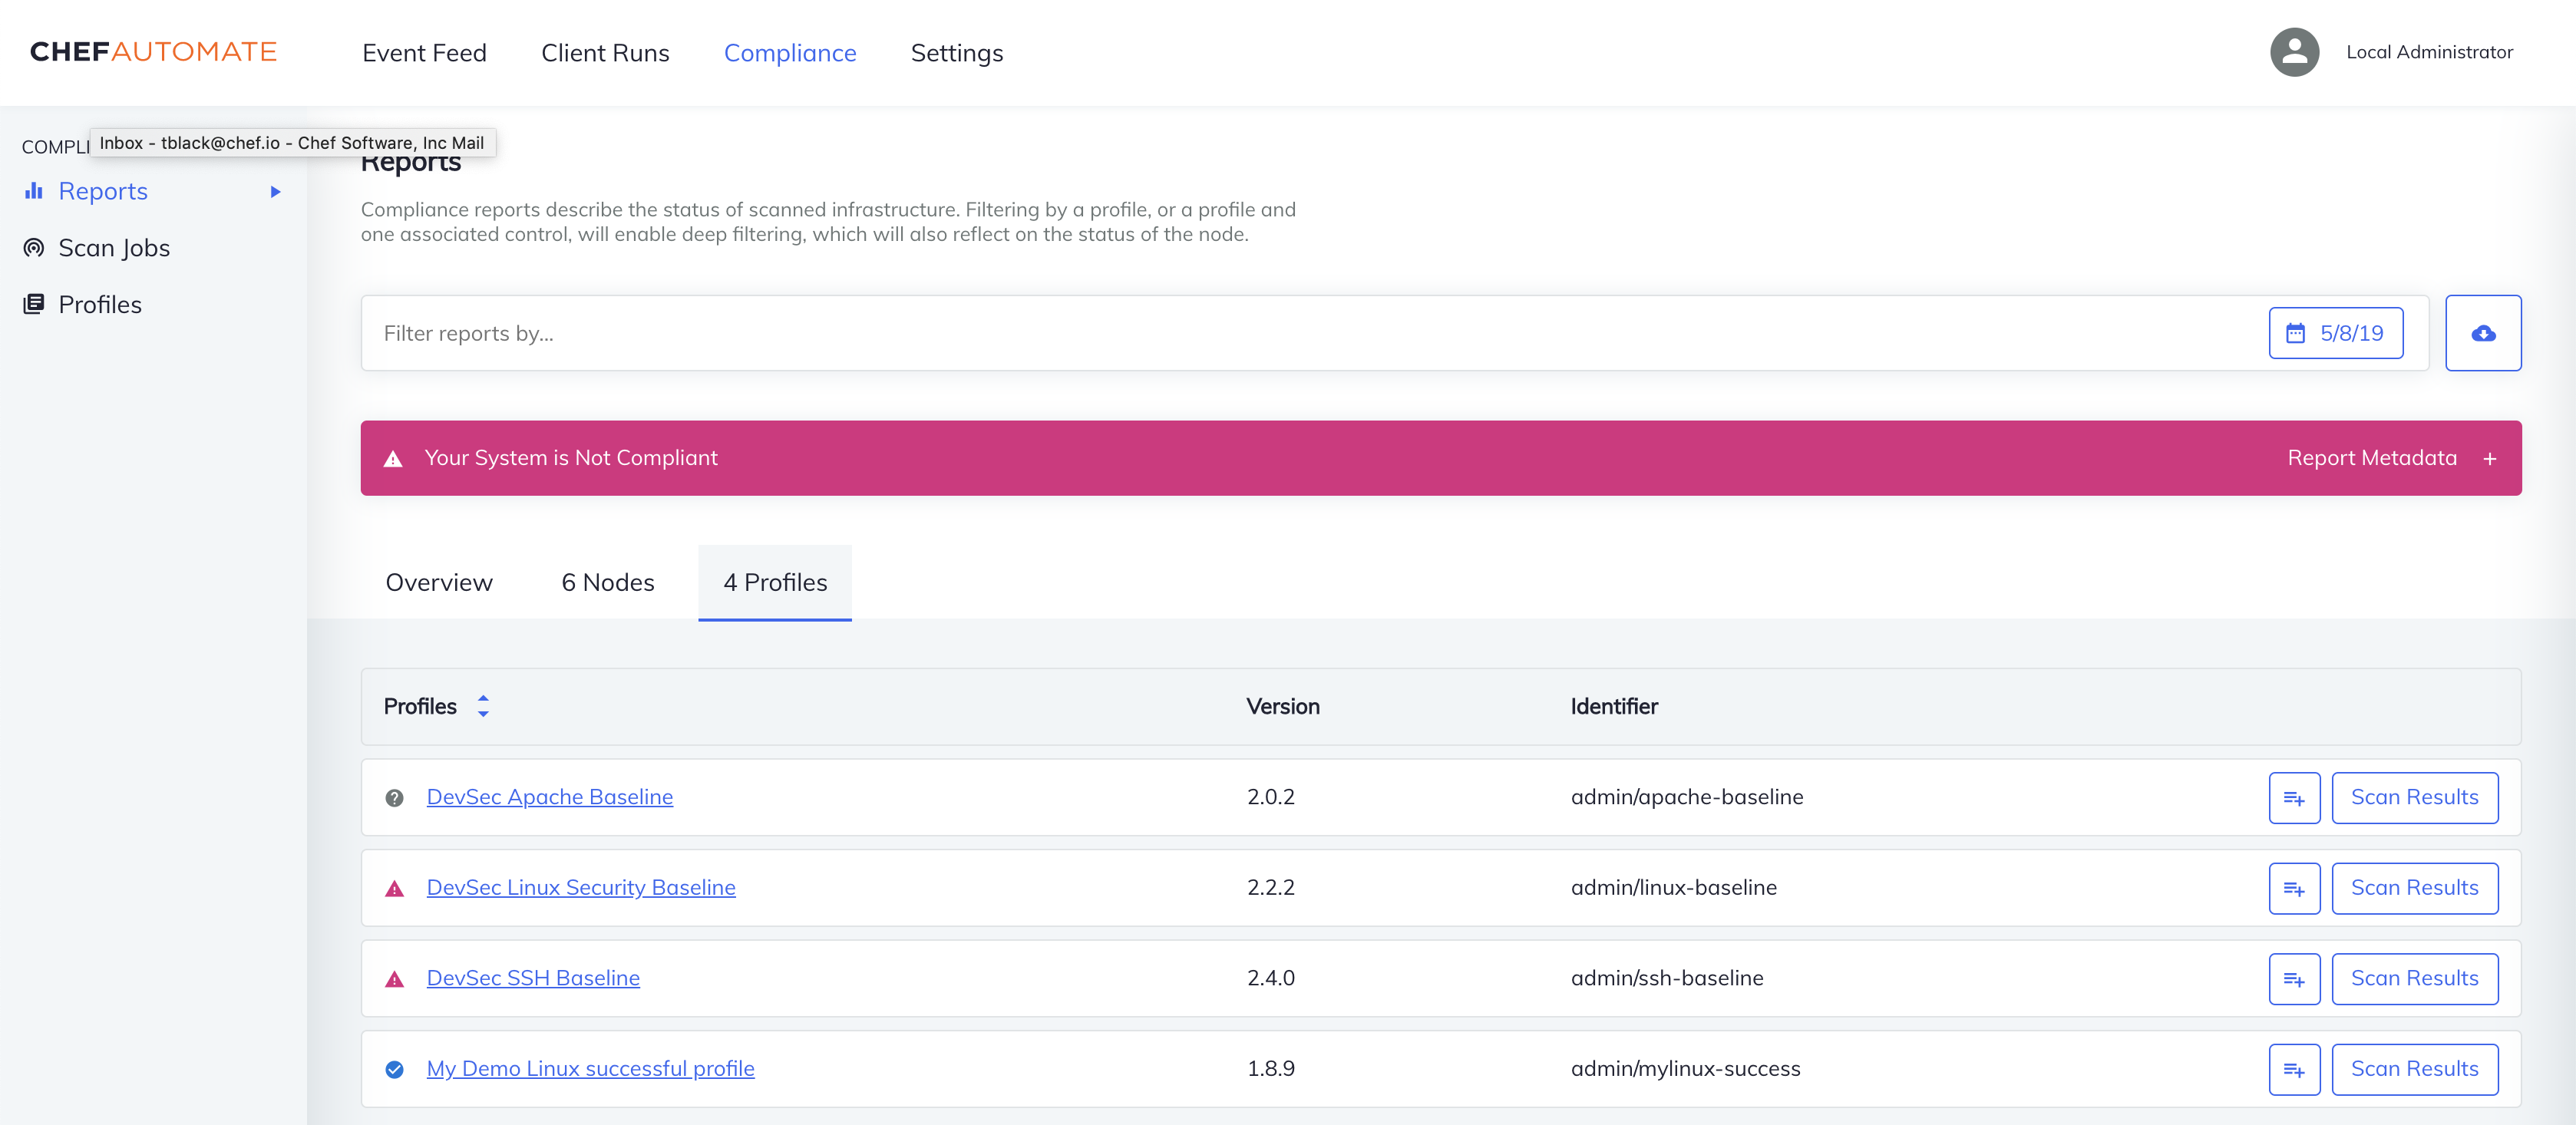
- Profile Title
- The name of the profile obtained from the Profile Store or uploaded.
- Version
- The semantic version identifier of the profile; you may need to update your profiles to get the most recent version.
- Identifier
- The name under which the profile is installed and a short profile title.
- Filter
- Select a node by selecting the filter icon on the right side of the row.
- Scan Results
- Displays the scan results summary for the selected profile. Selecting plus expands the list of nodes on which the profile was run. Select a node to see the control-level results.
- More Information
- Opens a control-level view of all of the runs for all of the controls within the profile. Selecting the scan results button displays all of the nodes on which the selected control has been run. Selecting a node from this list displays the scan results of the selected control on for the specific node. Selecting view source displays the InSpec controls.